
Every week there is a new screenshot on Reddit or on the NVIDIA forums. “Qwen3.8-27B at 71 tok/s on a single DGX Spark!” “SGLang is 3x faster than vLLM!” And every week I ask myself the same question. Faster at what?
I recently had the opportunity to play with a DGX Spark 128GB, so I wanted to make some tests personally, trying to find out what numbers (and output quality) I could extract from that device. It serves five AI agents that I use every day. Those agents don’t ask a model to multiply 37 by 41. They send prompts of 28k to 120k tokens full of tool output, they reason in both italian and english before every step and they call tools in long loops. So I stopped trusting other people’s charts. I took real requests from my agents and replayed them against three models under the same conditions: the one I run in production and two challengers.
This post covers how I built the test, the numbers each model got and why the most popular recipe ended up as the slowest of the three on my workload.
The Setup: Five Hermes Agents and One Spark
The agents run on Hermes Agent by Nous Research. Each agent is a separate container on my Unraid server with its own data, its own skills and its own Matrix bot. Each one has a single job:
| Agent | What it does | Typical traffic |
|---|---|---|
default | General assistant for university studies, revision podcasts and daily chores | Interactive, long sessions |
viaggio | Travel planning with MCP servers for flight and hotel search | Interactive, big tool outputs |
finance | Daily bank sync into Firefly III with dedup, categories and a review list | Cron, strict procedure |
homelab | Ops on my infrastructure via restricted SSH, Forgejo MCP, Home Assistant and Obsidian docs | Interactive + cron, tool-heavy |
diabete | Weekly health report built from Nightscout data | Cron, long structured output |
The models run on an NVIDIA DGX Spark (GB10, 128 GB of unified memory, about 273 GB/s of memory bandwidth). LiteLLM is the OpenAI-compatible front door and vLLM serves the model. All five agents share a single model instance.
Note
The Spark has plenty of memory and not much bandwidth. Decoding a single stream is bandwidth-bound. That’s why every model in this post uses speculative decoding (MTP or a draft model) to beat the “weights / bandwidth” ceiling.
The agents keep long sessions. Context size is the real enemy. In Hermes I cap it with compaction and with pruning of old tool outputs. A session rarely goes above 120k tokens:
# Appended to each agent's config.yaml
compression:
  threshold_tokens: 120000          # full LLM summary only above this
  proactive_prune_tokens: 70000     # above this, old tool outputs are demoted (no LLM call)
  proactive_prune_min_result_chars: 3000
auxiliary:
  compression:
    extra_body:
      chat_template_kwargs:
enable_thinking: false # summaries don't need reasoningThe Contenders
| Qwen3.8-Flash-Next (production) | Qwen3.8-27B | Qwen3.6-35B-A3B | |
|---|---|---|---|
| Architecture | MoE, 512 experts, 10 active | Dense 27B | MoE, ~3B active |
| Checkpoint | Official NVIDIA FP4 (~96 GB on disk) | RadixArk/Qwen3.8-27B-NVFP4 (~21 GB) | nvidia/Qwen3.6-35B-A3B-NVFP4 (~22 GB) |
| Engine | vLLM (myllmbox recipe v5.4 ) | SGLang (sxuff recipe ) | vLLM (NVIDIA’s Spark command) |
| Speculation | MTP, dynamic depth 3 to 7 | DFlash2 draft model, 16 draft tokens | MTP, 3 tokens |
Qwen3.8-27B: the “71 tok/s” recipe
The sxuff recipe is the fastest published single-Spark setup for the 27B I could find. It builds on the MiaAI-Lab scaffold . It pairs the stock NVFP4 target with a calibrated NVFP4 version of the z-lab DFlash2 block drafter (maurienne-ai/Qwen3.8-27B-DFlash2-NVFP4-RTNcal ).
I built the image from the repo’s Dockerfile, with the same pinned SGLang base digest and the same six overlay patches. I also verified every weight file against the SHA-256 manifests in the repo. The launch flags come from scripts/serve.sh. Only the served model name differs:
docker run -d --name ab-q27 --gpus all --ipc host --network host \
  --cpuset-cpus 5-9,15-19 --memory 110g --memory-swap 110g \
  -v $MODELS/Qwen3.8-27B-NVFP4-52d1adc5f38a:/model:ro \
  -v $MODELS/Qwen3.8-27B-DFlash2-NVFP4-RTNcal-bd7a934213c4:/draft:ro \
  sxuff/qwen38-27b-stock-dflash2:local \
  python3 -m sglang.launch_server --trust-remote-code --model-path /model \
    --served-model-name qwen38-27b --mem-fraction-static 0.70 --attention-backend flashinfer \
    --chunked-prefill-size 8192 --disable-prefill-cuda-graph \
    --kv-cache-dtype fp8_e4m3 --mamba-ssm-dtype bfloat16 \
    --mamba-full-memory-ratio 4.21 --mamba-radix-cache-strategy extra_buffer \
    --max-mamba-cache-size 50 --max-running-requests 10 --context-length 262144 \
    --random-seed 17 --reasoning-parser qwen3 --tool-call-parser qwen3_coder --sampling-defaults model \
    --enable-metrics --enable-cache-report --host 127.0.0.1 --port 8001 \
    --speculative-algorithm DFLASH --speculative-draft-model-path /draft \
--speculative-draft-model-quantization modelopt_fp4 --speculative-num-draft-tokens 16Qwen3.6-35B-A3B: NVIDIA’s own Spark command
For the 35B-A3B I used the official NVIDIA checkpoint with the vllm serve command that NVIDIA recommends for the Spark on the model card. It ran as plain vllm serve on the same vLLM image as production, without any myllmbox-specific flag. I changed a few things to match the other two arms:
--gpu-memory-utilizationfrom 0.4 to 0.70--max-num-seqsfrom 4 to 8- added
--enable-prompt-tokens-detailsto read cache hits - dropped
--load-format fastsafetensors
vllm serve /model --served-model-name qwen36-35b-a3b --host 127.0.0.1 --port 8002 \
  --tensor-parallel-size 1 --trust-remote-code \
  --kv-cache-dtype fp8 --attention-backend flashinfer \
  --moe-backend marlin --gpu-memory-utilization 0.70 --max-model-len 262144 \
  --max-num-seqs 8 --max-num-batched-tokens 8192 --enable-chunked-prefill \
  --async-scheduling --enable-prefix-caching --enable-prompt-tokens-details \
  --speculative-config '{"method":"mtp","num_speculative_tokens":3,"moe_backend":"triton"}' \
--reasoning-parser qwen3 --tool-call-parser qwen3_xml --enable-auto-tool-choiceQwen3.8-Flash-Next: the incumbent
Production runs the myllmbox vLLM build. This is the relevant part of the compose service:
qwen:
  image: myllmbox/qwen38-flash-next-vllm:v5.4
  command:
    - --moe-backend=marlin
    - --gpu-memory-utilization=0.70
    - --kv-cache-memory=8000000000
    - --kv-cache-dtype=fp8
    - --max-model-len=262144
    - --block-size=3456            # multiple of the attention ring and of 64
    - --prefix-match-unit=64       # cache hits every 64 tokens
    - --mamba-ssm-cache-dtype=bfloat16
    - --max-num-seqs=8
    - --enable-prefix-caching
    - --tool-call-parser=qwen3_xml
    - --reasoning-parser=qwen3
    - '--speculative-config={"method":"mtp","num_speculative_tokens":7,"rejection_sample_method":"block","draft_sample_method":"probabilistic"}'
- --async-schedulingBuilding a Fair Test
The goal was simple. Same requests, same order, same parameters, same machine, one model at a time.
Real requests from real sessions
Hermes stores every session in SQLite. I wrote a small read-only extractor that runs inside each agent container. It uses Hermes’ own loader. The loader returns the same history the agent restores for the model, compaction summaries and reasoning_content included. The only post-processing step reduces each message to the plain OpenAI fields (role, content, tool_calls, tool_call_id, reasoning_content).
from hermes_state import SessionDB
db = SessionDB(Path('/opt/data/state.db'), read_only=True)
conv = db.get_messages_as_conversation(session_id, repair_alternation=True)
# every assistant turn in the live transcript is a "case":
# prompt = system prompt + conv[:i], reference = conv[i]Hermes doesn’t store tool schemas with the session. I rebuilt them the same way the gateway does, with a throwaway AIAgent that uses the same toolsets. Each agent advertises 21 tools.
From each of the busiest sessions of the previous week I took the last 5 to 7 model calls, across all five agents. Then I counted the real prompt size with the Qwen3.8 chat template:
- 76 calls from 13 sessions: 18
default, 14viaggio, 15finance, 24homelab, 5diabete - Prompt size: 27.6k to 119.8k tokens, median ~55k
- 59 tool-call steps and 17 final answers to the user
I dropped 6 calls above 120k tokens. They came from a session recorded before I capped compaction. They don’t represent current traffic.
This is a teacher-forced replay. Every model sees the real history up to step i and produces step i. It only measures the next decision, one step at a time.
Same conditions for everyone
- Sampling: the model defaults. They are identical for all three (
temperature 1.0, top_p 0.95, top_k 20). The agents don’t override them. Production uses the same values. - Thinking on, as in production, with
max_tokenscapped at 8192. - Cold start: a fresh server process per model, then the sessions replayed in order. Consecutive calls of a session share a growing prefix. Prefix caching behaves the same way it does with the real agents.
- No other traffic: I stopped the five agents for the whole window. TTS, STT and embeddings stayed up (idle) for all three arms.
- Concurrency: after the sequential pass I fired 4 requests from 4 different agents at the same time.
The client is a streaming script of about 120 lines. TTFT is the first token of any kind, reasoning included. Decode speed starts after the first token:
for line in resp:                       # SSE stream
    ev = json.loads(line[5:])
    for ch in ev.get('choices') or []:
        d = ch.get('delta') or {}
        if d.get('reasoning_content') or d.get('content') or d.get('tool_calls'):
            if t_first is None:
                t_first = time.perf_counter()
...
decode_tps = (completion_tokens - 1) / (t_end - t_first)The Results
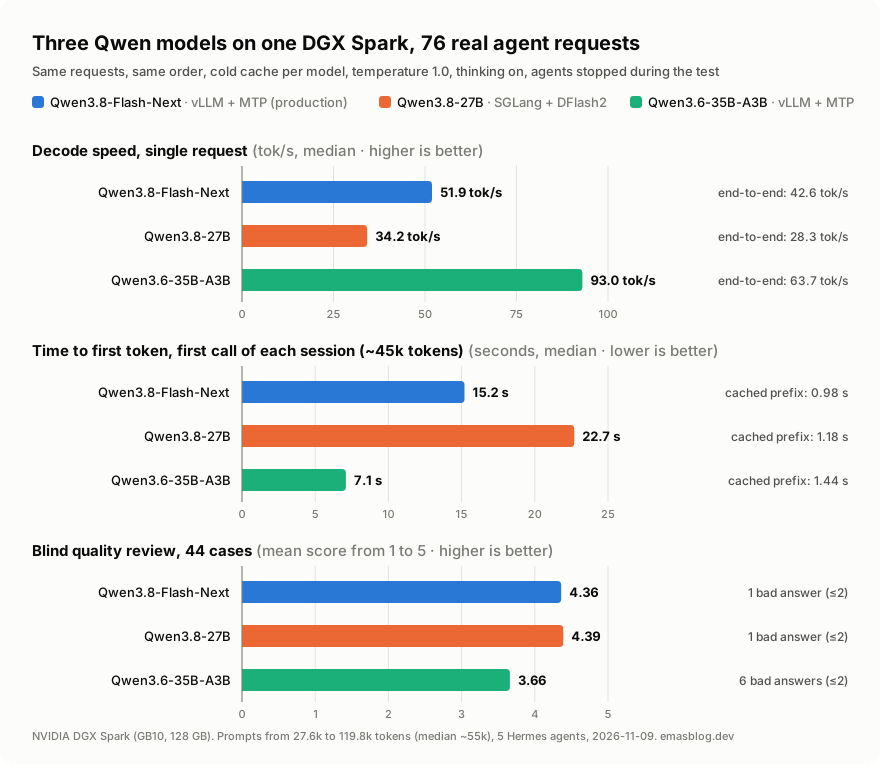
Speed
All three models answered all 76 requests with zero errors:
| Flash-Next | 27B + DFlash2 | 35B-A3B + MTP | |
|---|---|---|---|
| Decode tok/s, median | 51.9 | 34.2 | 93.0 |
| Decode tok/s, p10 to p90 | 44.9 to 61.8 | 26.1 to 48.6 | 81.1 to 108.4 |
| End-to-end tok/s, median (incl. prefill) | 42.6 | 28.3 | 63.7 |
| TTFT, first call of each session (median ~45k tokens, mostly uncached) | 15.2 s | 22.7 s | 7.1 s |
| TTFT, cached prefix, median | 0.98 s | 1.18 s | 1.44 s |
| Wall time for all 76 requests | 27.0 min | 46.0 min | 16.7 min |
| Output tokens (sum) | 66.6k | 74.3k | 73.2k |
The ranking is the same for every agent. The 35B-A3B sits between 89 and 100 tok/s. Flash-Next stays between 49 and 56. The 27B goes from 30 (homelab, viaggio) to 41 (finance).
Note
The 35B-A3B also reads less. The tokenizer is the same. The difference is in the chat template: Qwen3.6 drops the reasoning of earlier turns and Qwen3.8 keeps it. The same conversations came out at a median of 51.8k tokens instead of 55.1k. The longest one shrank from 119.8k to 94.6k. That’s part of how the model works and its TTFT includes it.
Four agents at once
| Flash-Next | 27B + DFlash2 | 35B-A3B + MTP | |
|---|---|---|---|
| Per-request decode tok/s | 10.3 | 9.9 | 45.8 |
| Aggregate tok/s | 34.7 | 23.0 | 116.1 |
| TTFT, median | 28.8 s | 48.4 s | 5.1 s |
This test is less clean than the sequential one. I replayed the last call of four sessions that had already run in the sequential pass. Flash-Next and the 27B had evicted most of those prefixes. Three of the four prompts had at most ~10k tokens in cache. Their TTFT includes several cold prefills of 35k to 75k tokens that compete with the decode of the other requests.
The 35B-A3B still had 91% to 96% of all four prompts in cache. Flash-Next is easy to explain. About 96 GB of weights leave room for a KV pool of only 200k to 250k tokens of conversations, shared by all agents. I haven’t dug into why SGLang evicted them for the 27B.
These numbers mix decode speed with cache retention. In a real day, agents come back to their sessions after a while. That makes retention a real advantage. Still, don’t read 45.8 vs 10.3 as pure decode speed.
Warning
With several agents at once, decode speed stops being the whole story. The prefill of an evicted prompt slows everyone else down. The number of sessions a server keeps warm can matter more than a clever drafter. On a 128 GB box, a ~96 GB model doesn’t leave much room for them.
Why the “71 tok/s” recipe got 28
The recipe’s 71.5 tok/s is whole-request throughput. It divides completion tokens by the total request time, prefill included. The comparable number on my traffic is the end-to-end median of 28.3 tok/s. Decode alone gives 34.2.
I checked twice that the image recipe, the weights and the flags matched. Then I read the recipe’s own protocol (protocol.json and fixtures.json). The 71.5 tok/s is the median of 18 requests run at temperature 0, with thinking disabled and prompts of a few lines. This table shows the current profile per fixture (median of 3 runs), taken from the repo’s own evidence file:
| Recipe fixture | tok/s |
|---|---|
copy_json (repeat a JSON that is in the prompt) | ~146 |
copy_python (repeat a Python file that is in the prompt) | ~140 |
code (write a short function) | ~88 |
math (37 × 41) | ~55 |
json (3-key object) | ~37 |
prose (three sentences of plain text) | ~18.6 |
A drafter shines when the output is predictable. Copying text that already sits in the prompt is as predictable as it gets. The accept len field in the SGLang logs from my run shows how many tokens each verification step produced:
Decode batch, #running-req: 1, #full token: 77366, ..., accept len: 5.20, accept rate: 0.28, gen throughput (token/s): 44.18
Decode batch, #running-req: 1, #full token: 77617, ..., accept len: 2.55, accept rate: 0.10, gen throughput (token/s): 21.64Across the 513 log lines of the run the average is 3.79 tokens per step with 16 drafted. The recipe reports 3.95 for its earlier DFlash2 study. The drafter behaved as expected. On Italian agentic text with reasoning I got 28.3 tok/s end-to-end. That beats the recipe’s own prose fixture (18.6 with the same metric). The recipe measures a different workload. For that workload its numbers are correct.
The same applies to “SGLang vs vLLM”. The comparison I see quoted most is this one from QAI . It pits SGLang with DFlash2 (24.9 to 41.2 tok/s) against vLLM without any speculation (12.6 tok/s). The article states this clearly. The same article measured vLLM reading a fresh 19.7k-token prompt 18% faster than SGLang. SGLang won on a cached prompt (0.2 s vs 0.5 s TTFT). Most of the headline gap comes from the drafter. The engine accounts for much less.
Quality
A fast agent is no upgrade if it books the wrong thing. So I looked at quality too.
Formal checks (all 76 cases):
| Flash-Next | 27B | 35B-A3B | |
|---|---|---|---|
| Expected a tool call, made one | 57/59 | 55/59 | 50/59 |
| Valid JSON arguments | 56/57 | 54/55 | 48/50 |
| Same tool as the original session | 44/59 | 48/59 | 39/59 |
| Expected an answer, wrote text | 12/17 | 14/17 | 15/17 |
| Chinese characters in output or reasoning | 0 | 0 | 0 |
The “same tool as the original” row favors Flash-Next because Flash-Next generated the original sessions. I didn’t use it as a score.
Blind review. I picked the 44 cases where a judgment matters. That means all 17 final answers plus the 27 tool steps where the three models didn’t make the same call (a different tool or text in place of a tool call). Each case showed the three responses as X/Y/Z in random order. The key stayed in a separate file. Claude (Opus 5.5) did the scoring. It scored each response from 1 to 5 against the context, looking at correctness, rule-following and honesty about what was done. The key was opened only after all 44 cases had a score.
| Flash-Next | 27B | 35B-A3B | |
|---|---|---|---|
| Mean score | 4.36 | 4.39 | 3.66 |
| Final answers | 4.59 | 4.47 | 3.76 |
| Tool steps | 4.22 | 4.33 | 3.59 |
| Bad answers (score ≤ 2) | 1 | 1 | 6 |
These are the six bad answers from the 35B-A3B. None of them is something you want from an unattended agent:
- A bank-sync cron run had a new bank consent link for me to approve. The model answered
[SILENT], Hermes’ token for “nothing to report”. - It appended an invented
[CRON_FAILURE] model_not_foundto a sync report that was otherwise correct. - A memory update had just failed. The final summary said the memory was updated.
- It claimed the headless browser has full internet access (the browser can reach exactly one host). The same answer had several Italian mistakes.
- It ran
docker psinside the agent container, where Docker isn’t available. - It tried to write the whole weekly health report in a single tool call and hit my test’s 8192-token cap. The agents don’t set a cap. Part of this one is an artifact of the test.
It also made two mistakes that scored a 3. It stated a few facts it had never checked. It deleted a skill with rm -rf instead of using the hermes skill tool.
The 27B made milder mistakes overall. It got the weekdays wrong in an calendar event reminder and wrote a couple of English status lines in an Italian conversation. In one tool step it reasoned until the 8192-token cap and produced nothing. The worst Flash-Next answer loaded a skill when it should have closed a report. It also dropped one Portuguese word (“melhor”) into Italian.
What I’m Doing With This
I’m staying on Flash-Next. On my agents it matches the quality of the dense 27B and it’s 50% faster. It also has the best TTFT on cached prompts. An agent loop hits a cached prompt most of the time (63 of my 76 calls).
The 27B with DFlash2 brings nothing to this workload. It has the same quality and it’s slower on every metric. Its drafter loses the advantage under concurrency. It would make sense for agents that mostly write code or edit files.
The 35B-A3B is the one to watch. It did the same 76 requests in 62% of the time. With four agents at once it kept their sessions in cache and didn’t have to read them again. About a third of a typical agent turn goes to running tools. Tools don’t get faster with a faster model. My median turn would drop from ~166 s to roughly ~130 s. The problem is where it fails. Strict cron procedures are exactly where my agents can’t afford mistakes. A wrong [SILENT] means I never see a bank consent that is about to expire. It could still earn a place for low-stakes interactive agents (travel planning, for example) with per-agent routing in LiteLLM.
Wrapping Up
Benchmark your own traffic/workload. A recipe measured on copy tasks at temperature 0 says very little about agents that reason in Italian over 60k tokens of tool output. And many “engine A vs engine B” charts end up comparing drafters.
The whole test took a Saturday afternoon (yes, my wife was not happy about it), but at least now I can say that Qwen3.8-Flash-Next is the best of the three models for my workflow on the DGX Spark.

I would like to test a Strix Halo next, but that won’t happen soon. Spending 3k+ euros on one is really too much for me. If you’re feeling generous, let me know 😄
Happy benchmarking!